
grafana

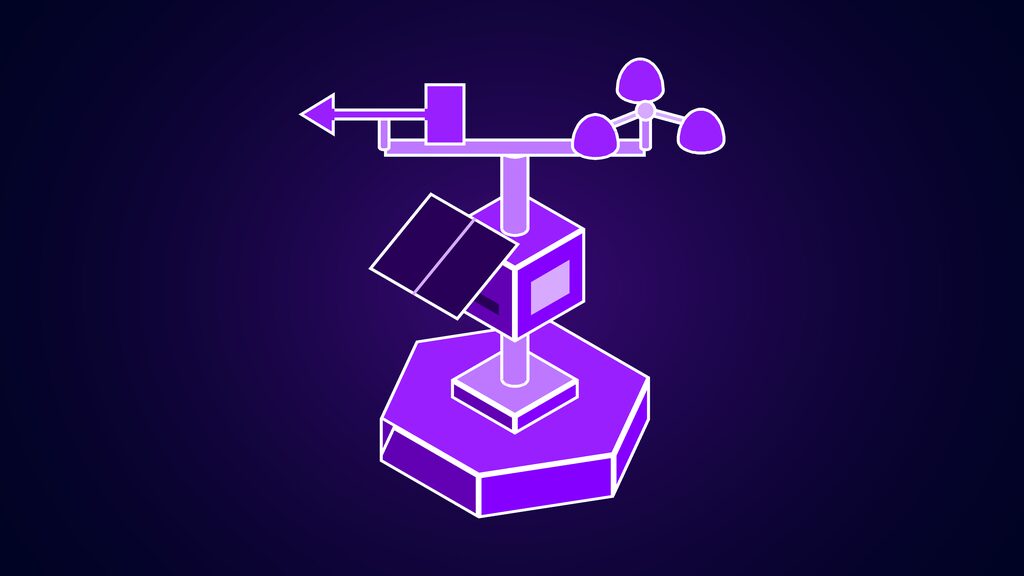
farm monitoring system sensors software you already use a weather station mast with wind cups

How to Build a Farm Monitoring System with the Sensors and Software You Already Use

Most farms already own more sensors than they realise: a weather station, grain store cables, a milk tank controller, EID readers and machinery telematics. This guide shows how to join them into one farm monitoring system: audit what you own, get data out through APIs, Modbus, MQTT, exports or alarm relays, connect over LoRaWAN and 4G, choose between Home Assistant, Node-RED and Grafana, set alerts from AHDB and milk-cooling thresholds, and budget with a worked example (£5,370 in year one, £6,810 over three years) and FETF 2026 reference prices.
Read more
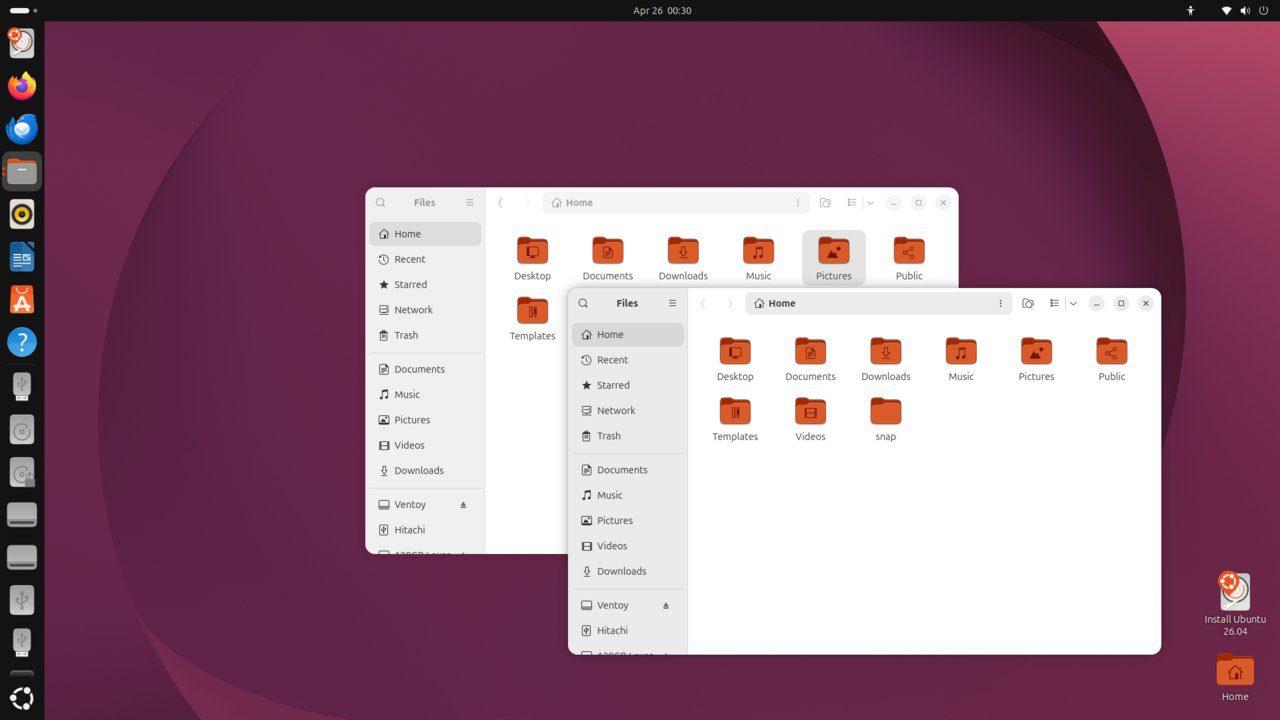
How to Set Up Software RAID with mdadm on Ubuntu 26.04 — step-by-step Linux tutorial on Progressive Robot

How to Install Prometheus and Grafana on Ubuntu 26.04

Prometheus is an open-source metrics collection and alerting system, while Grafana provides beautiful dashboards for visualising those metrics. Together they form the most popular open-source monitoring stack. This guide installs both on Ubuntu 26.04 LTS with Nginx and SSL. Tested and valid on: Ubuntu 26.04 LTS Prerequisites Ubuntu 26.04 LTS with Nginx installed A user […]

Read more
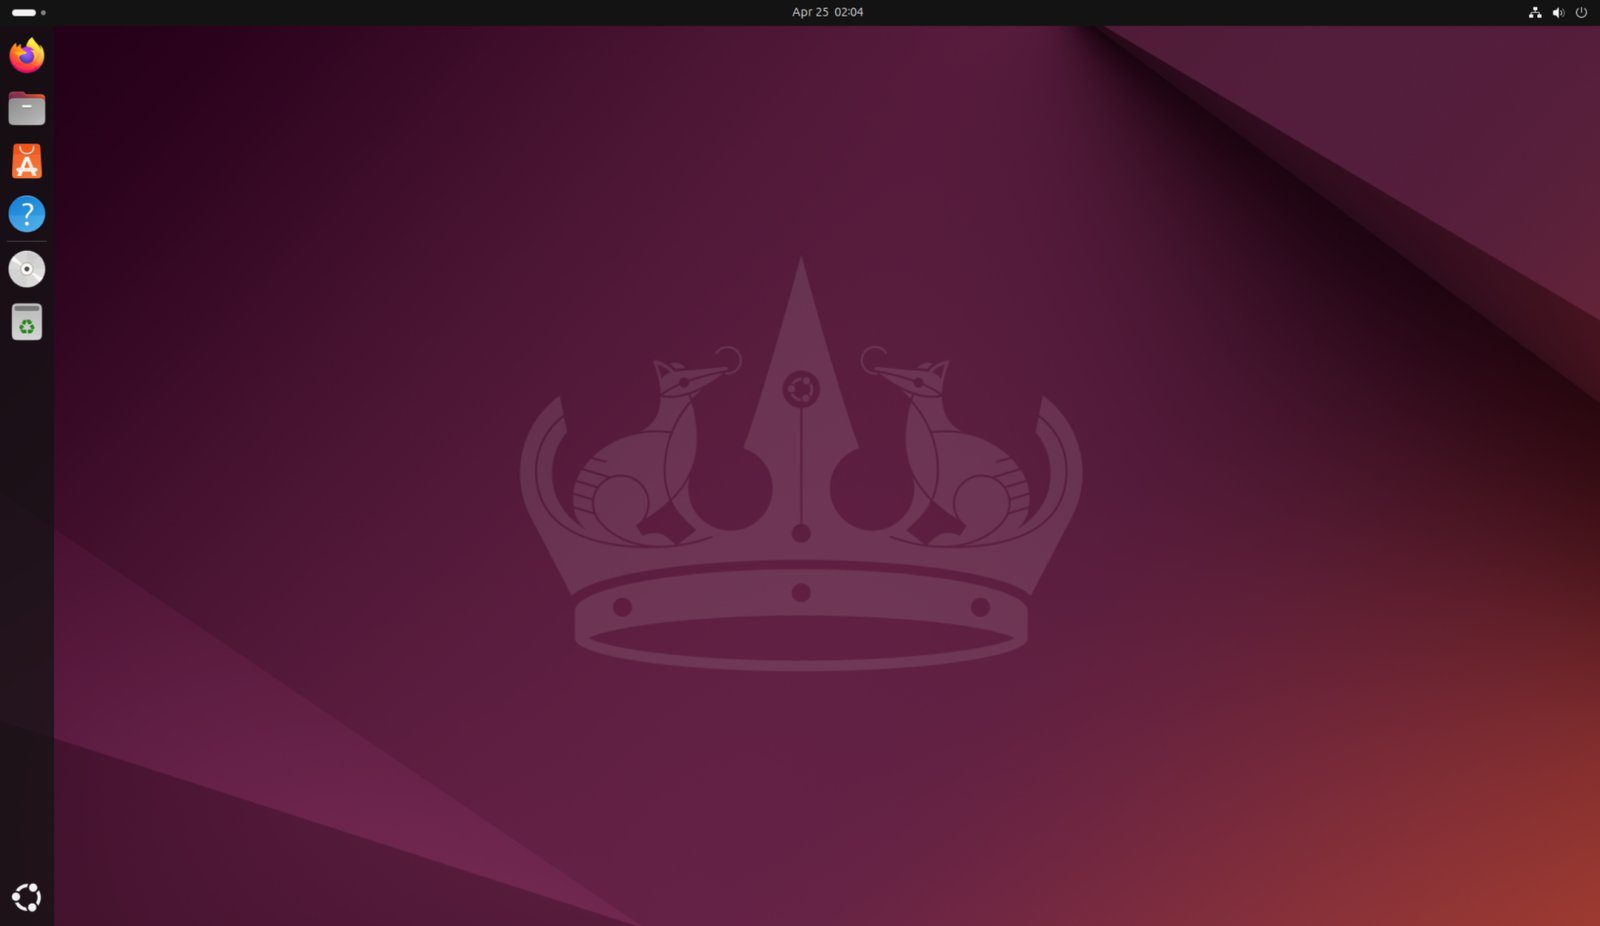
How to Set Up Software RAID with mdadm on Ubuntu 24.04 — step-by-step Linux tutorial on Progressive Robot

How to Install Prometheus and Grafana on Ubuntu 24.04

Prometheus is a powerful time-series monitoring system and Grafana is the leading visualisation dashboard. Together they form the most popular open-source monitoring stack. This guide installs both on Ubuntu 24.04 LTS. Tested and valid on: Ubuntu 24.04 LTS Prerequisites Ubuntu 24.04 LTS server A user with sudo privileges Minimum 2 GB RAM Step 1 – […]

Read more
CHAT









